

If you want charts, diagrams, or visual explainers created from text, prompts, or code, there are now several strong options. Mermaid is the most widely known. But it's only one part of a broader landscape that includes Graphviz, PlantUML, D2, SVG, and QuickChart.
This guide compares them with a practical lens: auto-generation, flexibility, free usage, longevity, adoption, momentum, LLM compatibility, and real-world use cases.
An important theme runs through all of this: text-to-graphics is not just about generating an image once. It's about roundtripping too. In other words, how easy is it to edit, iterate, maintain, and regenerate the visual later? That matters a lot if you are working with an LLM. A generated PNG may look good at first, but it is much harder to tweak accurately later. A text-based source can be revised, versioned, and reused.
1) The Landscape
- Diagram DSLs: Mermaid, Graphviz, PlantUML, D2
(DSL = Domain-Specific Language) - Code-based: Python (Diagrams)
- Output format: SVG
- API-driven charts: QuickChart
Key distinction: structure diagrams vs data-driven charts.
More important distinction: some tools are much better for roundtripping than others. If you expect to come back later and refine the visual, text-based definitions usually beat direct image generation by a wide margin.
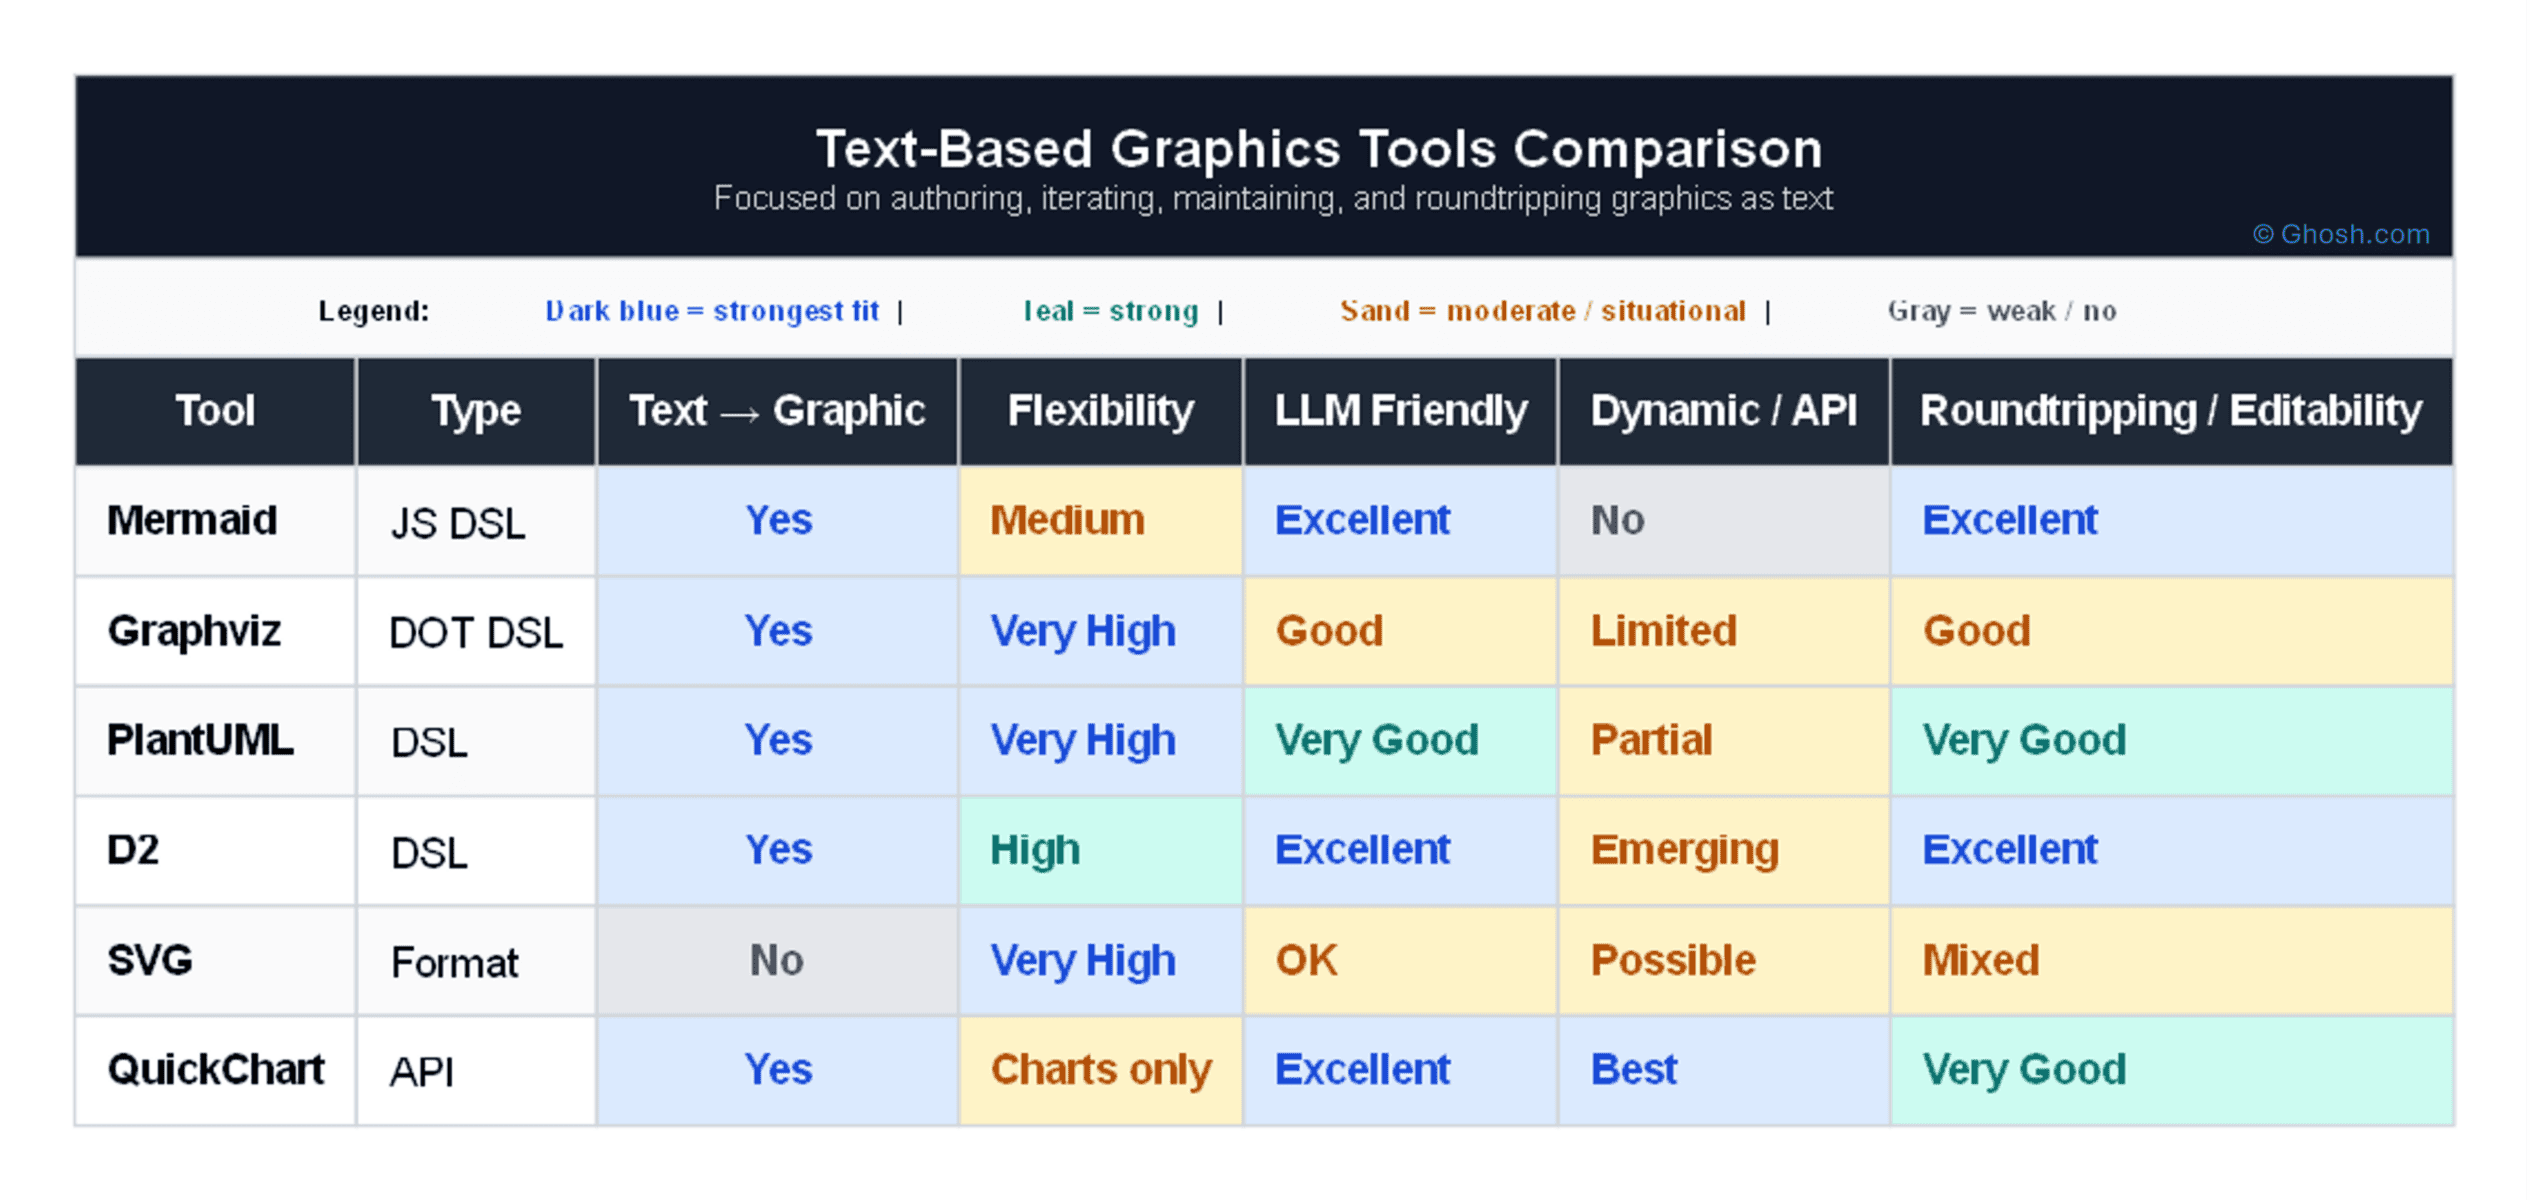
2) Comparison Table
| Tool | Type | Text → Auto | Flexibility | LLM Friendly | Dynamic / API | Roundtripping / Editability |
|---|---|---|---|---|---|---|
| Mermaid | JS DSL | Yes | Medium | Excellent | No | Excellent |
| Graphviz | DOT DSL | Yes | Very High | Good | Limited | Good |
| PlantUML | DSL | Yes | Very High | Very Good | Partial | Very Good |
| D2 | DSL | Yes | High | Excellent | Emerging | Excellent |
| SVG | Format | No | Very High | OK | Possible | Mixed |
| QuickChart | API | Yes | Charts only | Excellent | Best | Very Good |
3) Best Tool by Use Case
| Use Case | Best Tool | Why | Alternatives |
|---|---|---|---|
| Flowcharts | Mermaid | Fast, readable, widely supported, and easy to revise later | D2, PlantUML |
| Sequence diagrams | PlantUML | Most expressive + mature, with strong maintainability | Mermaid |
| System architecture diagrams | D2 | Clean layouts, modern syntax, and excellent roundtripping | PlantUML, Mermaid |
| Marketecture diagrams | D2 | Better control with cleaner visuals while staying editable as text | SVG (for polish), Mermaid (quick draft) |
| Dependency graphs / networks | Graphviz | Best layout algorithms for graph-heavy visuals | D2 |
| Gartner-style quadrant | SVG | Precise positioning matters more here, though roundtripping is weaker | QuickChart (scatter), Mermaid (limited) |
| Bar / line / pie charts | QuickChart | Built for charts, easy JSON configs, and easy regeneration from updated data | Chart.js (direct), SVG |
| Dynamic charts (API-driven) | QuickChart | URL-based rendering with live data and easy regeneration on demand | Custom backend + SVG |
| Docs / blog diagrams | Mermaid | Embeds easily and stays maintainable over time | D2 |
| LLM-generated diagrams | Mermaid / D2 | Lowest error rate and easiest to iteratively refine | QuickChart (for charts) |
| Pixel-perfect visuals | SVG | Full control, but weaker for ongoing iteration unless carefully structured | Export from any tool |
4) Why QuickChart Is Different
QuickChart's superpower is dynamic generation via URL parameters.
https://quickchart.io/chart?c=- No rendering pipeline
- No frontend required
- Works in emails, dashboards, APIs
- Easy to regenerate from changed parameters or updated data
Think: prompt → JSON → URL → image
That makes QuickChart especially strong when the image is not a one-time asset, but a visual that needs to be regenerated repeatedly from new inputs.
5) How LLMs Change Things
- Best: Mermaid, D2, QuickChart
- OK: PlantUML
- Harder: Graphviz, SVG
LLMs reduce friction, but structured text formats still win for iteration. That is the core roundtripping advantage. You can ask the LLM to adjust labels, reorder steps, update data, or restyle the output while preserving the underlying source. By contrast, once an LLM generates a flat image, accurate edits become much harder.
That is why the right comparison is not just image generation. It is text-to-graphics that remain editable.
6) Bottom Line
- Default: Mermaid
- Modern upgrade: D2
- Complex diagrams: PlantUML
- Graph layouts: Graphviz
- Charts & dynamic: QuickChart
- Final polish: SVG
Best workflow:
Prompt → Mermaid / D2 / QuickChart → export PNG/SVG → publish
If you expect to iterate, collaborate, or maintain the visual later, favor tools that preserve a clean text representation. That's the real advantage of text-to-graphics tools in the LLM era: not just generation, but reliable regeneration.

Leave A Comment